
|
|
 03-29-2015, 05:10 AM
|
|
|
__
Join Date: Oct 2006
Location: Springpatch
Casino cash: $4173447
|
Where have all the QBs gone?
http://bleacherreport.com/articles/2...rterbacks-gone
Where Have All the Quarterbacks Gone? By Ty Schalter , NFL National Lead Writer Mar 26, 2015 The NFL has never been hungrier for good quarterbacks. While the few lucky teams with quality signal-callers make deep playoff runs again and again, the desperate rest of the lot aren't just scraping the bottom of the barrel; they're licking dirty plates and rifling through dumpsters. The grand old generation of today's top quarterbacks (Peyton Manning, Tom Brady, Drew Brees, Philip Rivers, Ben Roethlisberger, Tony Romo, et al.) are nearing the end of their careers, adding teams whose offensive tables are set to the lengthening bread lines. The 2014 free-agent crop was a quarterbacking Dust Bowl. There was a minor bidding war for Josh McCown, a career 76.1 passer who'll be celebrating his 36th birthday in July. The Cleveland Browns were the "winners" of that one, snagging the replacement-level veteran to a three-year, $14 million contract with $6.3 million guaranteed, per Spotrac. This draft class is the thinnest quarterback crop since...well, the last one. There are only two blue-chip prospectsthe one some scouts were calling "radioactive" last season, per Mike Florio of NBC Sports via Yahoo, and another whose college system makes him hard to project, as explained by Bleacher Report's Matt Bowen. How come there are so few haves and so many have-nots? Why is the quarterback talent pool drying up? Is it the players, the way they're being scouted or how they're being used? The Great Flattening Passing has slowly reshaped the NFL since a set of late 1970s rules changes. Using Pro-Football-Reference.com data, we can calculate league-wide per-game passing averages for each of the last seven five-year periods: NFL League-wide Passing Efficiency Rates, 1980-2014 Year Att Cmp% Rate Yds 1980-1984 31.44 56.1 71.74 202.06 1984-1988 32.02 55.02 71.74 205.1 1989-1993 31.4 57.36 74.68 199.14 1994-1998 33.4 57.14 75.76 209.46 1999-2003 32.68 59.08 77.78 207.16 2004-2009 32.62 60.48 80.06 210.48 2010-2014 34.54 61.12 83.94 231 Inexorable progress toward passing perfection! Nearly every single period features more pass attempts, which are completed more frequently, more efficiently and for more total yards than the one before. Since 1980, the average NFL game features over 40 more passing yards for each team and nearly 16 rating points of passer efficiency. The NFL passer efficiency metric itself reveals how priorities have changed. It was introduced in 1973, during the days of grip-it-and-rip-it guys such as Terry Bradshaw and Ken Stabler, and madcap scramblers such as Fran Tarkenton and Archie Manning. The formula indexes completion, touchdown and interception rate, as well as average yards per attempt, to league averages from 1960-1970. This metric has been remarkably good at identifying the league's best passers. Coaches and personnel departments have spent decades using it as a benchmark and adapting both their offenses and players to maximize it. It's no wonder today's quarterbacks rate massively better: 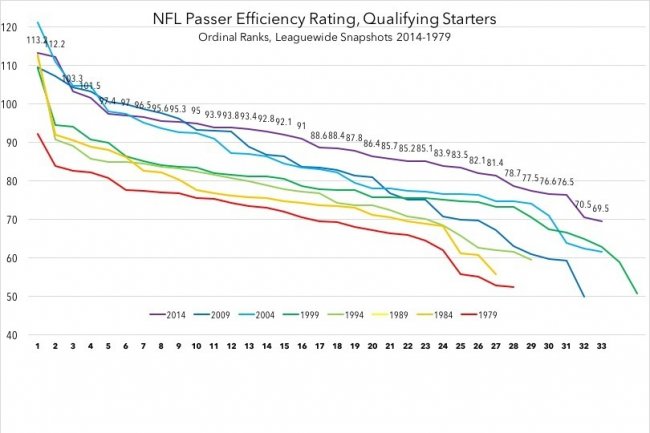 The league-wide improvement in quarterback play has been astonishing. The highest-rated passer of 1979, Roger Staubach, would have finished 14th in 2014. The lowest-rated qualifying passer of 2014, Blake Bortles, would have finished 18th in 1979. The biggest effect hasn't been on the top couple of passers or the bottom few, though, but the great mass in the middle. Only five quarterbacks hit 80.0 or higher in 1979; a whopping 27 of 33 qualifying quarterbacks did at least that well in 2014. Only five quarterbacks cracked 90.0 in 1999; in this past season, 16 passers topped that mark. Jay Cutler, the Chicago Bears quarterback whose miserable 2014 season cost both his head coach and general manager their jobs, would have been the fifth-highest-rated passer of 1999. Efficient, but Effective? For a moment, though, let's set the composite rating aside and break out these rate stats individually: Touchdown rate, interception rate, average yards per attempt and average yards per completion. How does all this hyper-efficient quarterback play translate into on-field success? 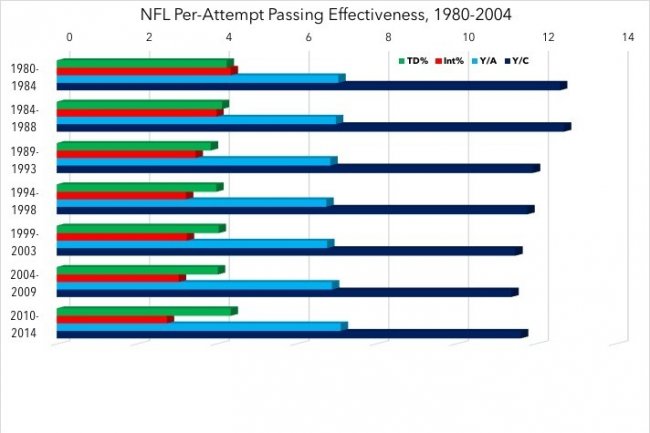 For all that surgical precision, passing is only a little more effective. Since the rules opened the passing game, offensive architects responded to incredible pressure to reduce interceptions. Over the last 30 years, they've continually adapted their schemes to give quarterbacks safer options. The results have been spectacular: The league-wide interception rate dropped from 4.6 percent in 1980 to just 2.5 percent in 2014. That risk aversion, though, comes at a price. Touchdown rate dropped precipitously from the first half of the 1980s to the second, and again from the second half of the 1980s to the early 1990s. Picks were down by 20.2 percent from the first period to the third, but touchdowns fell 9.4 percent. As teams passed up the risky deep throw for the safety of the slant, the length of the average NFL completion shortened by two feet (0.68 yards) in 10 years. The average yards gained per attempt fell from 7.06 to 6.86, despite the higher completion rate. From the early 1990s on, while interceptions kept falling, touchdowns and yards per attempt stayed flat for a decade. In the early 2000s, they started creeping back up again. A dramatic bump in touchdown rate (from 4.04 percent to 4.36 percent) in the last five seasons means we're finally seeing passing scores as often as we did during Reagan's first term. How were NFL coordinators able to make things so easy for their quarterbacks? The widespread introduction of slot receivers helped, as did the introduction of pass-catching running backs, athletic offensive tackles and deep-threat tight ends. Increasingly widespread, multiple formations and pre-snap motion allow teams to hide core concepts under many layers of window dressing. More than anything else, though, offense has changed because of the shotgun snap. Under the Gun Thanks to the Football Outsiders' Premium DVOA Database, we can track shotgun usage for the final year of each of our first six five-year periods (the database only goes back to 1989). In just over two decades, shotgun has gone from a sparsely-used gimmick to the foundation of NFL offense: 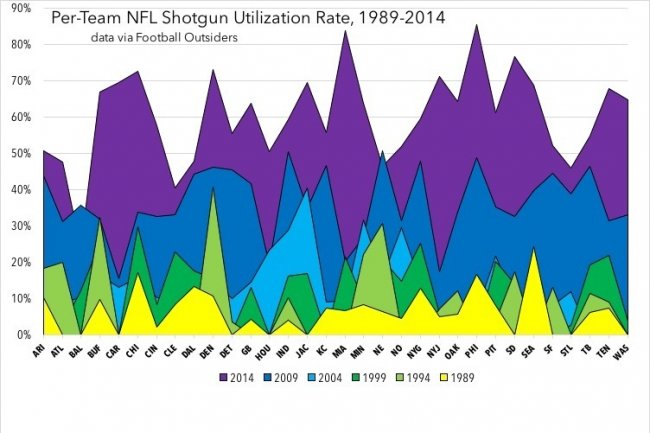 In 1989, just a handful of teams used shotgun more than 10 percent of the time. The Seattle Seahawks used it most often, lining up in the 'gun on 24.3 percent of snaps. In 2014, just a handful of teams used shotgun in fewer than half their snaps. Only one squad (Baltimore Ravens, 23.8 percent) had a shotgun utilization rate below 40 percent. Today's quarterbacks are playing with a much better view of the field, and they have more time to find an open man and increased awareness of the pass rush. It's indisputable: The multiple-target, quick-decision, shotgun-based offenses of today have flattened the curve, making even the worst starting quarterbacks pretty darn good, and mediocre quarterbacks excellent. That's why teams are so desperate to get an edge: In a league where all quarterbacks are good, only great ones make a difference. If Everyone's Super, No One Is Going back to the first chart, you'll notice something: Average yards-per-completion never went back up. Today, the average NFL completion is a full yard shorter than when Dave Mustaine was still in Metallica. Go back to the passer efficiency rating chart, and you'll notice something else: 2014's quarterbacks have a massive lead on the rest of history from the 10-slot on downbut from No. 3 to No. 10, the 2009 group and some of the 2004 group, supercede this past year's performers. The second tier of really good quarterbacks has been flattened into the third and fourth tiers of decent ones. In today's NFL, only the Aaron Rodgerses and Andrew Lucks of the world can combine old-school big-throw aggression with modern, intricate precisionand they're incredibly rare. That insatiable hunger for stud quarterbacks has revolutionized the way quarterbacks are drafted, and not for the better: 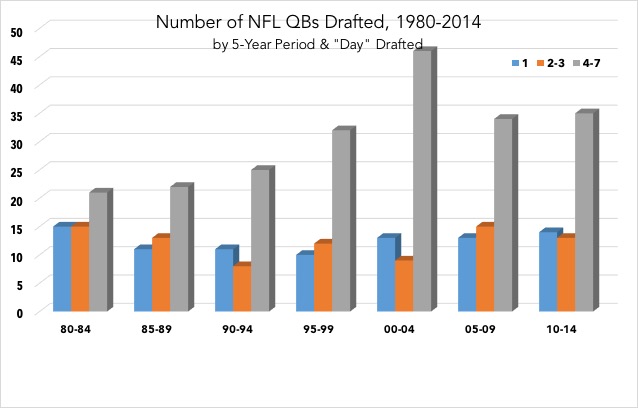 NFL teams have consistently drafted more quarterbacks over the years. This chart goes back to our seven five-year periods, but it breaks the signal-callers into tiers based on the current draft format: first-rounders, second- and third-rounders, fourth- through seventh-rounders. The legendary class of 1983 inflated the first-round crop of our first period, but we see teams generally held steady drafting quarterbacks at the top of the class while taking late-round fliers at an almost exponential rate. Teams were reaching in the later rounds, trying to find that diamond in the rough. In the last 10 years, the total number of quarterbacks drafted has fallen back a little from that 2000-2004 high, but more of them are first- and second-day guys. Instead of taking a lot of fliers, teams are reaching for quarterbacks with precious top picks. Into the Fire Once acquired, teams test their over-drafted quarterbacks early and often: 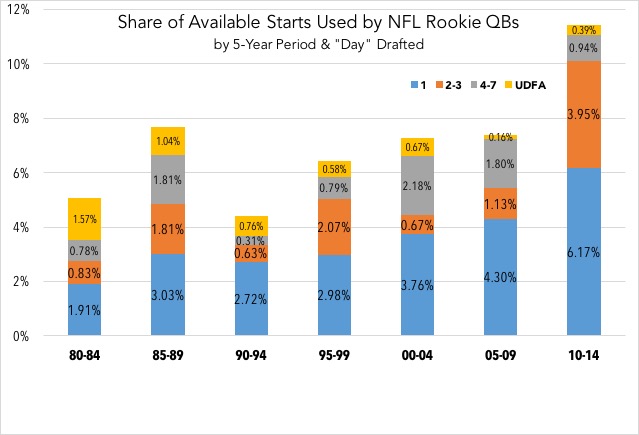 Here's how many starts rookie quarterbacks have accounted for periods, taking into account the number of teams in the league and games played in those five seasons. The 1987 strike affected the 1985-89 period; that spring, teams went gonzo for late-round and undrafted quarterbacks. Many of those "rookies" were replacement players who never saw the field again; they were excluded (as best possible) from this data, but the stockpiling still shows up here. The '87 bump aside, we see two very obvious trends: rookies accounting for more and more starts throughout the years and a bigger fraction of them being first-round picks. Over the last five years, first-rounders alone got more starts than all rookies combined in 1980-84, 1990-94 and very nearly 1995-99. There are some less obvious trends, too: Second- and third-round rookie quarterbacks are getting twice as many starts now as ever before, as teams throw less talented (or less ready) quarterbacks into the deep end hoping they'll sink or swim. Third-day and undrafted quarterbacks are paying the price. Historically, they've always been long shots to start as rookies, but these days, there's almost zero chance of that happening. The high-pick guys with the multiyear deals are going to get every chance to succeed. Well, maybe not every chance. What happens to the EJ Manuels and the Geno Smiths of the world, the over-drafted quarterbacks who start too early, too often? Let's look at how many starts quarterbacks drafted in each of our seven periods get over their first four years: 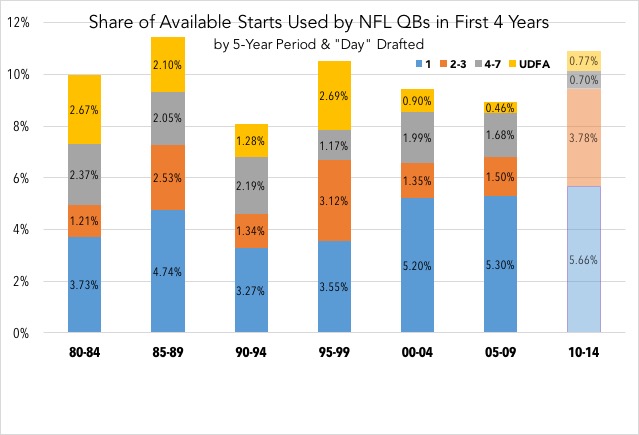 The graph is practically inverted. From 1980-84, rookies got 5.1 percent of all available startsbut those same rookies accounted for 9.98 percent of available starts over their first four years. That's effectively double. Again, partially fueled by the 1987 strike, the 1985-89 group got an even bigger share of starts over their first four years, 11.4 percent of all games. Ever since then, young quarterbacks have been given an ever-shrinking slice of pie. The 1995-2000 second-day group was bolstered by the *cough* juggernaut second-round class of 1995: Stoney Case, Todd Collins, Billy Joe Hobert, Kordell Stewart and Eric Zeier, who somehow collectively managed 80 career starts. That group's UDFA class also seems shockingly capableexcept it includes Kurt Warner, the human outlier, among their ranks. Even then, the beefy 1995-99 group doesn't counter the overall trend: Quarterbacks are getting more and more starts, almost exponentially so, in their rookie years, but less over their first four seasons. The 2010-2014 class, of course, has barely been chewed up, let alone spit back outwhich is why they appear translucent on this chartbut with the Buffalo Bills trading for Matt Cassel and New York Jets nabbing Ryan Fitzpatrick, it's hard to see Manuel and Smith bucking the trend. Even guys such as Colin Kaepernick and Andy Dalton, who together unseated that 1995 group as the hardest-working class of second-rounders ever, may be looking for work come this time next year. The Talent Disposal This is the real problem with the schematic, systematic flattening of NFL offenses: Not all quarterbacks are natural trigger-pullers. There are plenty of quarterbacks more than talented enough to win in the NFL being cast aside because they don't fit into the ruthlessly efficient, painfully square-edged Joe Montana mold. Unique talents such as Cutler, Kaepernick, Ryan Tannehill and Matthew Stafford came into the NFL as breathtaking passers or jaw-dropping athletes, but may spend their whole careers getting booed for not fitting quick slants into tiny windows like Warner did. Meanwhile, teams are falling all over themselves to roll out painfully mediocre pocket-passing retreads who've never played a down of inspiring football. In a way, it makes sense: Why shell out high draft picks or big dollars for a spectacular talent when he won't bite ankles any more efficiently than a scrap-heap ankle-biter? This is the grand irony of the scouting process. Teams spend countless hours and shameful sums of money flying executives and scouts all over the country to assess, quantify and project each quarterback's unique physical and mental toolsetthen give them one season to play like Peyton Manning or not. This April, Jameis Winston and Marcus Mariota will be served on a silver platter. The Brett Hundleys and Bryce Pettys of the class will get zapped in the microwave and dumped in some Tupperware. Injuries and/or a disastrous season will even spur some teams to unscrew Mason jars full of Blake Simses and Connor Hallidays, and dip a finger in just to see. If none of them immediately satisfy their team's hunger for an elite difference-maker, they'll get pitchedand their team will go hunting for leftovers. |
|
Posts: 59,314
  |

|
|
03-29-2015, 12:17 PM
|
#16 | |
|
Life is changing..
Join Date: Jul 2012
Location: NW Missouri
Casino cash: $1574900
|
Quote:
Yes. |
|
|
Posts: 39,123
|
|
|
03-29-2015, 12:40 PM
|
#17 | ||
|
Supporter
Join Date: Aug 2000
Casino cash: $6838598
|
Quote:
Quote:
__________________
We need the kind of courage that can withstand the subtle corruption of the cynics - E.W. |
||
|
Posts: 95,642
|
|
|
03-29-2015, 12:47 PM
|
#18 |
|
The Insider
Join Date: Jan 2004
Location: Lake of the Ozarks
Casino cash: $1978752
|
Ownership groups and fans are impatience bastards that want instant gratification. Thus rookies get rushed and game mangers stay on too long. Combine that with the increase in passing which running ball should be used more especially in the development of a young quarterback.
|
|
Posts: 49,801
|
|
|
03-29-2015, 01:07 PM
|
#19 |
|
Veteran
Join Date: Mar 2013
Casino cash: $10019798
|
No real advancements in rushing a QB.
Pressure is what causes a lot of QB trouble. It's combated by doing short passes and shotgun. The NFL could force OTs to stop cheating back from the LOS. That would help pass rushers get to the QB. |
|
Posts: 1,532
|
|
|
03-29-2015, 01:12 PM
|
#20 | ||
|
Kindness in words...
Join Date: Apr 2007
Location: Zion
Casino cash: $10025483
|
Quote:
Quote:
|
||
|
Posts: 15,450
|
|
|
03-29-2015, 01:16 PM
|
#21 | |
|
The Beast Inside Your Head
Join Date: Jul 2006
Location: Parts Unknown
Casino cash: $1689122
|
Quote:
|
|
|
Posts: 25,908
|
|
|
03-29-2015, 01:29 PM
|
#22 | |
|
Beyond the Rapids
Join Date: May 2003
Location: Langley, VA
Casino cash: $-370000
|
Quote:
|
|
|
Posts: 80,659
|
|
|
03-29-2015, 01:35 PM
|
#23 | |||
|
Veteran
Join Date: Feb 2012
Location: DE
Casino cash: $9775019
|
Quote:
Quote:
Quote:
 |
|||
|
Posts: 3,812
|
|
|
03-29-2015, 01:46 PM
|
#24 |
|
Starter
Join Date: Dec 2012
Location: Olathe KS
Casino cash: $10012920
|
Nice article. Wouldn't be surprised to see the resurgabce of the Running back in the NFL since the League is so focused passing wise. A good offensive line is going to be critical in this teams overall progression and development of key players as well as good coaching.
The reason people loved Trent green so much was even with how good Priest and our O-Line was, he constantly took shots down the field. I believe in 2001, he was one of the NFL's leaders in INTS thrown (25 I think?). Alex smith, Grbac, and Cassel have all been short yardage QBs. Constant check downs within 5-8 yards of the line after running it 3 times. You need to be able to throw it deep and get bigger chunks of yardage during drives than constantly running a 2 back Set with PA Cross as your go to pass play. I would love it if Alex threw down field more. But again, he's just got to hit windows in the Cover 4/6 |
|
Posts: 284
|
|
|
03-29-2015, 02:25 PM
|
#25 | |
|
Supporter
Join Date: Sep 2000
Location: Hollywood, CA
Casino cash: $10053648
|
Quote:
Reid wanted an accurate WCO QB and he has that in Smith. What he hasn't had is a consistent offensive line and YAC playmakers, which the WCO needs to succeed. |
|
|
Posts: 88,960
|
|
|
03-29-2015, 02:33 PM
|
#26 | |
|
MVP
Join Date: Jan 2007
Location: Missouri
Casino cash: $1582250
|
Quote:
 |
|
|
Posts: 8,309
|
|
|
03-29-2015, 02:46 PM
|
#27 | |
|
Supporter
Join Date: Aug 2000
Casino cash: $6838598
|
Quote:

__________________
We need the kind of courage that can withstand the subtle corruption of the cynics - E.W. |
|
|
Posts: 95,642
|
|
|
03-29-2015, 02:50 PM
|
#28 | |
|
MFIC
Join Date: Jul 2009
Location: Tromsø, Norway
Casino cash: $3819219
|
Quote:
 |
|
|
Posts: 7,771
|
|
|
03-29-2015, 02:54 PM
|
#29 |
|
....
Join Date: Apr 2009
Location: Somewhere Kansas
Casino cash: $8659352
|
pooptaco.
|
|
Posts: 27,731
|
|
|
03-29-2015, 02:59 PM
|
#30 | |
|
Supporter
Join Date: Aug 2000
Casino cash: $6838598
|
Quote:
You could be pooptacoing literally anything.
__________________
We need the kind of courage that can withstand the subtle corruption of the cynics - E.W. |
|
|
Posts: 95,642
|
|


|
|
|


 Where have all the QBs gone?


 Linear Mode

